Technique 24 of 31
The Fatware Matrix
Your product should undergo a regular diet and exercise to stay in top shape.
- Product Management
- Feature Evaluation
- Optimization
In short
The Fatware Matrix finds redundant product features. Place each feature on a 3x3 grid of customer value (no, mandatory, additional) against maintenance cost (high, medium, low) to label it fat, bone or muscle. Weighting by cost shows whether the product is Fatware, Boneware or Muscleware, what to remove, optimise or invest in, and supports the 20 Rule.
For: Product managers and development teams
The Problem
Agile teams aim to maximize value, yet many overlook a hidden drain—redundant features. As products grow, unnecessary functionality creeps in, increasing maintenance costs, slowing development, and confusing users.1 This unnoticed bloat weakens efficiency and competitiveness. Feature creep and technical debt accumulate over time, making it increasingly difficult to maintain a streamlined, effective product.2
The Experiment
To address this, I worked with product managers and development teams to create the Fatware Matrix, a diagnostic tool that identifies and eliminates excess functionality. Inspired by principles of diet and exercise, it helps teams trim redundant features while strengthening core product value. By applying this framework, teams enhanced user experience and improved development efficiency.
How Do You Use the Fatware Matrix to Map Value and Maintenance Costs?
The Fatware Matrix offers a comprehensive view of your product’s feature landscape by considering two crucial aspects:
Value They Bring: Vertical Axis
The vertical axis represents the value that features deliver to end users, categorized into three options:
- No Value—Features that are meaningless or even detrimental to the end-user experience (Indifferent/Reverse in Kano’s model;3 Neutrals in Cadotte and Turgeon’s model4).
- Mandatory Value—Features that end users consider essential and expect as a baseline (Must-Be/One-Dimensional in Kano’s model;5 Dissatisfiers in Cadotte and Turgeon’s model;6 Givens in Hill, Roach, and Allen’s model7).
- Additional Value—Features that surprise and delight end users, exceeding their expectations (Attractive in Kano’s model;8 Satisfiers in Cadotte and Turgeon’s model;9 Satisfaction Drivers in Hill, Roach, and Allen’s model10).
Maintenance Costs They Require: Horizontal Axis
The horizontal axis represents the maintenance costs associated with each feature, encompassing factors such as change costs, maintenance time, operational expenses, and customer complaint handling time.11
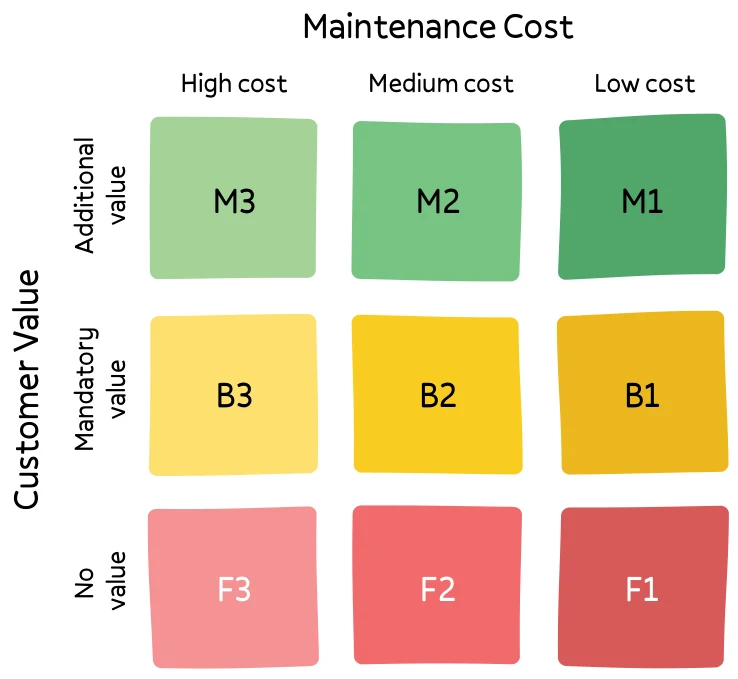
| Customer Value | High cost | Medium cost | Low cost |
|---|---|---|---|
| Additional value | M3 | M2 | M1 |
| Mandatory value | B3 | B2 | B1 |
| No value | F3 | F2 | F1 |
- The letters are associated with the type of value the features bring: F – Fat, B – Bone, M – Muscle.
- The numbers determine the size of the maintenance costs the features require.
- Colors provide additional information about value and cost levels.
- The letter, number, and color together determine the type of feature.
For example, feature F3:
- Brings minimal or no benefit—that’s why it’s this color;
- Requires high maintenance costs—that’s why its color in the matrix is so bright, and the number is as large as possible.
What Is Your Product’s Somatotype?
To assess your product’s composition and determine its somatotype, follow these steps:
-
Identify the product features. The most challenging aspect is creating a comprehensive list of all the features of your product. If doing so for the entire product seems impossible, you can start by focusing on a specific component that you believe may be the most extensive or feature-rich.12
-
Evaluate features on the Fatware Matrix. Position each feature from Step 1 on the Fatware Matrix, considering the dimensions of value and maintenance cost.
-
Assess the number of features allocated to each quadrant of the Fatware Matrix.
-
Multiply the count in each quadrant by the corresponding maintenance cost value. Feeling puzzled? Here’s the concept: Suppose you have 10 features in quadrant B3. Multiply that count by the maintenance cost value of 3, which corresponds to B3.
-
Sum and normalize the rows. Sum up the values in each row. Divide the resulting numbers by the total sum of values in the entire Fatware Matrix to normalize the distribution.
Here is an example of all these calculations for a product with 19 features:
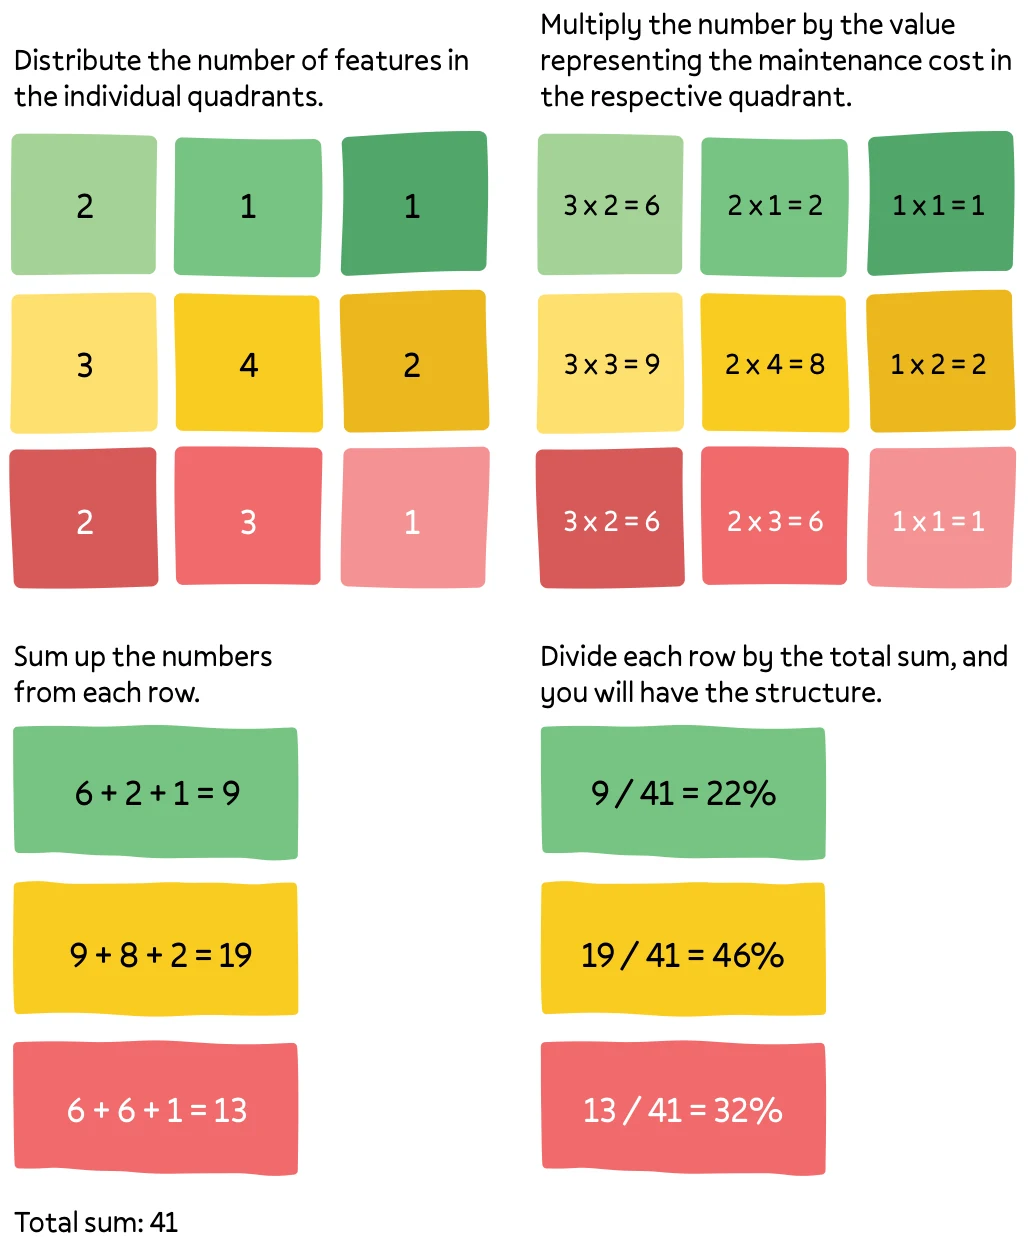
Row Features (high / medium / low cost) Multiplied by cost Row sum Share of 41 Muscle 2 / 1 / 1 3 x 2 = 6, 2 x 1 = 2, 1 x 1 = 1 9 9 / 41 = 22% Bone 3 / 4 / 2 3 x 3 = 9, 2 x 4 = 8, 1 x 2 = 2 19 19 / 41 = 46% Fat 2 / 3 / 1 3 x 2 = 6, 2 x 3 = 6, 1 x 1 = 1 13 13 / 41 = 32% -
Determine your product’s feature structure. Based on the normalized distribution, your product falls into one of the following types:
- Fatware—If fat represents more than 20% of the composition, indicating a high number of non-value-adding features that increase maintenance costs. Such products are burdensome to develop and maintain.
- Muscleware—If fat is less than 20% and muscles (value-adding features) account for more than 30% of the composition. This is an ideal scenario with a well-balanced product.
- Boneware—If the composition falls outside the above criteria. In this case, the product may primarily consist of “bones” (essential but less attractive features), lacking in appealing elements that captivate end-users.
By analyzing your product, you can gain insights into your product’s feature composition and identify areas for improvement.
Here are three sample product compositions and their corresponding feature structures for reference:
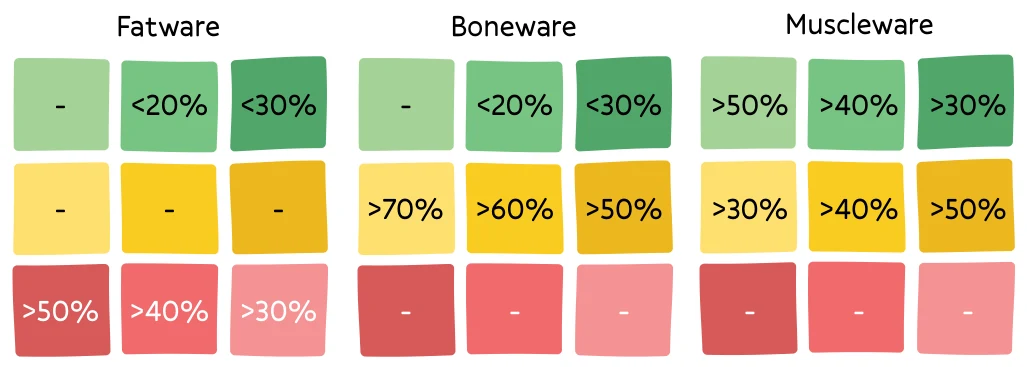
| Row | Fatware | Boneware | Muscleware |
|---|---|---|---|
| Muscle | -, <20%, <30% | -, <20%, <30% | >50%, >40%, >30% |
| Bone | -, -, - | >70%, >60%, >50% | >30%, >40%, >50% |
| Fat | >50%, >40%, >30% | -, -, - | -, -, - |
Which Option Should I Prioritize—Diet or Exercise?
Depending on the specific feature structure of your product, you may decide to put it on a diet. This means carefully assessing whether to add new features and what they should be. For example, let’s assume your product is Fatware. The task is to help it lose some excess functions before adding new ones. If it’s Muscleware, it might be time to add more attractive features13
We all know that excellent shape is not achieved by diet alone. Therefore, it’s good to include some exercises to melt away excess fat. For products classified as Muscleware, it’s an opportunity to enhance their strength and adaptability. Focus on incorporating attractive features that surprise and delight users. These additions will improve the overall experience and increase the product’s value.14
Remember, achieving excellent feature structure requires a balanced approach. Let’s delve into the table below, which outlines specific actions based on the value and cost characteristics of each functionality:
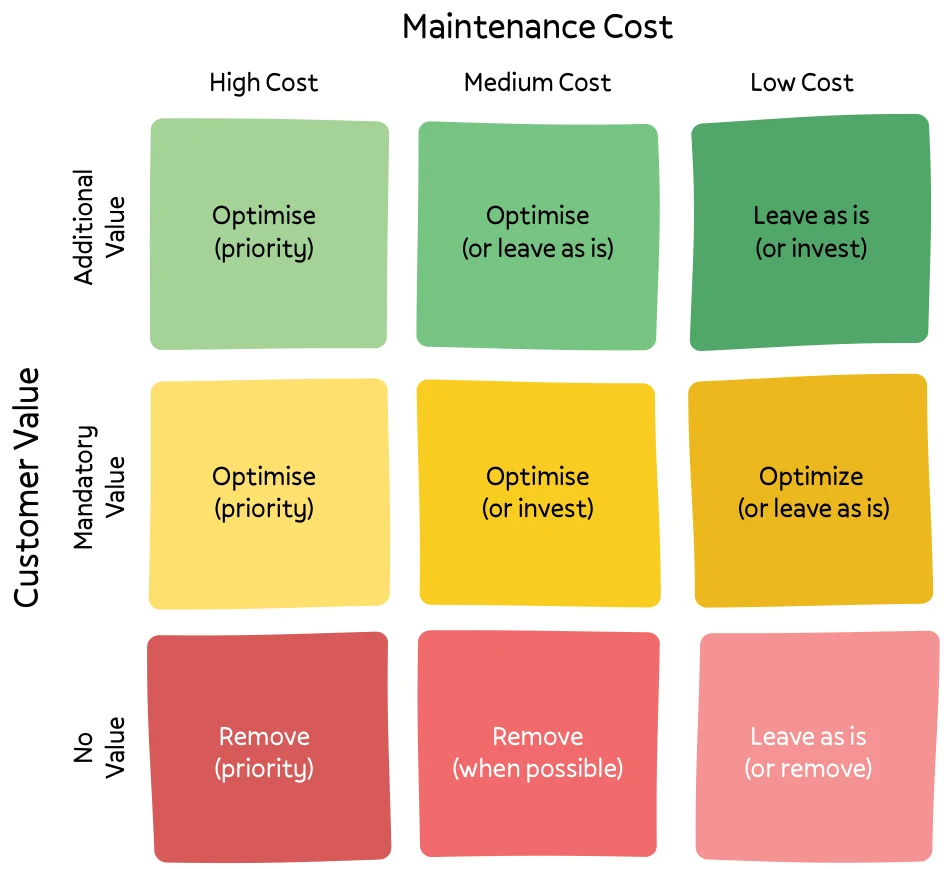
| Customer Value | High Cost | Medium Cost | Low Cost |
|---|---|---|---|
| Additional Value | Optimise (priority) | Optimise (or leave as is) | Leave as is (or invest) |
| Mandatory Value | Optimise (priority) | Optimise (or invest) | Optimize (or leave as is) |
| No Value | Remove (priority) | Remove (when possible) | Leave as is (or remove) |
What Is the 20 Rule?
Have you ever come across Barry Schwartz’s paradox of choice?15 It challenges the belief that more options lead to greater satisfaction. In reality, an abundance of choices often causes stress, discomfort, and demotivation.
One noteworthy experiment supporting this concept is the renowned jam experiment conducted by Iyengar and Lepper.16 In a grocery store, they presented two tasting sections: one offering a limited selection of jams (only six flavors) and the other a wide array of choices (a total of 24 flavors). The results were astonishing. While the extensive selection initially sparked interest, the percentage of participants who actually purchased a jar of jam was significantly lower compared to the section with fewer options—3% versus 30%! Fascinating, isn’t it?
Considering that the functionalities of our products can be seen as options for end users, shouldn’t we embrace the principle of “less is more”?17
That’s where the 20 Rule comes into play. It states:
Annually, we systematically eliminate a minimum of 20% of the functionalities in our product.
When implementing the 20 Rule, the Fatware Matrix becomes invaluable. It swiftly identifies the 20% of functionalities that should be removed, ensuring a lean product.
I have successfully applied this principle not only in managing products professionally but also in simplifying my personal life, such as reducing the number of shirts in my wardrobe. The result? I am a content minimalist.
References
- M. V. Mäntylä and J. Vanhanen, “Software Deployment Activities and Challenges - A Case Study of Four Software Product Companies,” in 16th European Conference on Software Maintenance and Reengineering, (2012): 131-140.
- K. Power, “Understanding the Impact of Technical Debt on the Capacity and Velocity of Teams and Organizations: Viewing Team and Organization Capacity as a Portfolio of Real Options,” in IEEE/ACM International Workshop on Managing Technical Debt (MTD), (2013): 28-31.
- N. Kano, N. Seraku, F. Takahashi, and S. Tsuji, “Attractive Quality and Must-Be Quality,” Journal of the Japanese Society for Quality Control 14, no. 2 (1984): 39–48.
- E. R. Cadotte and N. Turgeon, “Dissatisfiers and Satisfiers: Suggestions from Consumer Complaints and Compliments,” Journal of Consumer Satisfaction, Dissatisfaction and Complaining Behavior 1, no. 1 (1988): 74–79.
- Kano et al., “Attractive Quality and Must-Be Quality.”
- Cadotte and Turgeon, “Dissatisfiers and Satisfiers.”
- N. Hill, G. Roche, and R. Allen, Customer Satisfaction: The Customer Experience Through the Customer’s Eyes (Cogent Publishing, 2007).
- Kano et al., “Attractive Quality and Must-Be Quality.”
- Cadotte and Turgeon, “Dissatisfiers and Satisfiers.”
- Hill et al., Customer Satisfaction.
- S. G. Eick, T. L. Graves, A. F. Karr, J. S. Marron, and A. Mockus, “Does Code Decay? Assessing the Evidence from Change Management Data,” IEEE Transactions on Software Engineering 27, no. 1 (2001): 1–12.
- J. Pruitt and T. Adlin, The Persona Lifecycle: Keeping People in Mind Throughout Product Design, (Morgan Kaufmann, 2006).
- D. Norman, Emotional Design: Why We Love (or Hate) Everyday Things, (Basic Books, 2004).
- M. Poppendieck and T. Poppendieck, Lean Software Development: An Agile Toolkit, (Addison-Wesley, 2003).
- B. Schwartz, The Paradox of Choice: Why More Is Less (Harper Perennial, 2004).
- S. S. Iyengar and M. R. Lepper, “When Choice Is Demotivating: Can One Desire Too Much of a Good Thing?” Journal of Personality and Social Psychology 79, no. 6 (2000): 995–1006.
- J. Maeda, The Laws of Simplicity (MIT Press, 2006).
From Never Stop Experimenting by Stavros Stavru, PhD, illustrated by Iva Grueva. Published here in full on .
How to cite this technique
Stavru, S. (2025). The Fatware Matrix. In Never Stop Experimenting: 31 Real-World Experiments for Continuous Growth in Work and Life. Morgan James Publishing. https://neverstopexperimenting.com/techniques/fatware-matrix
Related techniques

23 · Product & delivery
Zmey Planning
Transform your estimation into a legendary masterpiece.

31 · Retrospectives
The Replay Check
Determine the extent to which others are pleased with the outcomes of your initiative.
01 · Foundation
The NSE Ratio
Uncover the optimal frequency for engaging in new experiments.
One new experiment, now and then
New techniques, real-world results and behind-the-scenes stories from Stavros. No spam; unsubscribe anytime.